











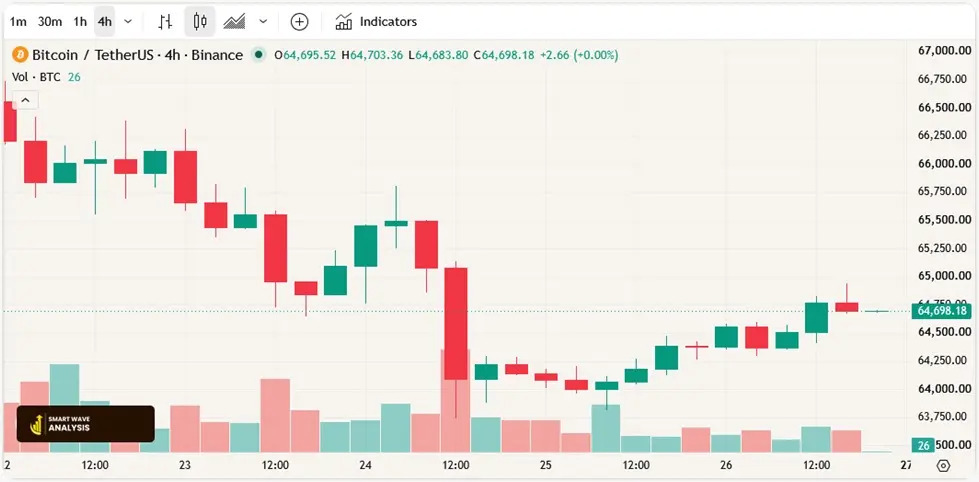


Bitcoin (BTC/USDT) 4H Wave Update: Corrective Dip Holds, Bulls Eye $66,700
Bitcoin pulled back. Then it stopped. That pause is exactly what traders watching the 4-hour chart have been waiting to see before deciding whether the bulls still have control.
Quick Answer
Bitcoin's recent 4H pullback has held above key support, keeping the broader bullish structure intact. If buyers defend this zone, the next upside target sits near $66,700, a resistance level that could open the door to further gains. A confirmed breakdown below support would put that view on hold.
What's Happening on the 4H Chart Right Now
Bitcoin has spent the past several sessions correcting after a strong upward push. That's normal. Markets rarely move in a straight line, and pullbacks are part of how healthy trends develop.
The important detail here is where the dip stopped. Price found buyers at a support zone instead of breaking through it, which is the first sign this is a corrective dip rather than the start of a deeper decline.
A corrective dip, in plain terms, is a short-term pullback within a larger uptrend. It's different from a trend reversal, which is when the broader direction actually changes.
Reading the Setup Through Elliott Wave
Elliott Wave theory is a method traders use to break price action into repeating patterns: five waves moving in the direction of the trend, followed by three waves correcting against it. It doesn't predict the future with certainty, but it gives traders a structured way to read where price might be within a larger cycle.
On Bitcoin's current structure, the strongest and most extended phase of a move is typically the third wave. That's the phase most technical analysts watch most closely, since it tends to produce the sharpest price acceleration and the clearest momentum signals.
A pullback that holds above the prior low, without breaking back into the territory of an earlier wave, generally supports the idea that the larger uptrend is still intact rather than ending.
Why $66,700 Matters as the Next Target
Resistance is a price level where selling pressure has previously been strong enough to stop an advance. $66,700 fits that description on Bitcoin's recent chart history.
Price has approached this zone before and been turned back. That makes it a logical level for bulls to target again, since clearing it would remove a level that's already proven it can cap upside moves.
| Level Type | Price Zone | What It Represents |
|---|---|---|
| Recent support (holding) | Current dip zone | Where buyers stepped in to stop the correction |
| Key resistance target | $66,700 | Prior level that has capped upside advances |
| Invalidation zone | Below recent swing low | A break here would challenge the bullish structure |
Clearing $66,700 wouldn't guarantee an extended rally, but it would confirm that buyers have regained enough momentum to challenge a level that previously held them back.
What Would Invalidate the Bullish Read
No technical setup is guaranteed. Elliott Wave analysis works with invalidation levels — specific price points where, if broken, the bullish structure is no longer considered intact.
For Bitcoin's current setup, that level sits below the recent swing low that formed during this pullback. A confirmed break below it, especially on a 4H closing basis, would shift the picture from "healthy correction" to "something has changed."
This is why traders watch closing prices rather than brief wicks below a level. A quick dip that recovers within the same candle carries far less weight than a confirmed close below support.
How Traders Typically Approach This Kind of Setup
Retail traders watching a setup like this generally look for a few confirming signals before treating a bounce as valid:
- Price holding above support across multiple candles, not just a single touch
- Volume picking up on the move back toward resistance
- No breakdown below the most recent swing low
For a closer look at how this wave count is developing on the live chart, SmartWave Analysis tracks Bitcoin's BTC/USDT Elliott Wave structure with updated Fibonacci levels on its Bitcoin page, which lays out the current wave labels in more detail.
Frequently Asked Questions
What does a corrective dip mean in Bitcoin trading? A corrective dip is a short-term pullback within a larger uptrend, distinct from a full trend reversal. It reflects normal profit-taking or short-term selling pressure rather than a change in the broader trend.
Why is $66,700 an important level for Bitcoin? $66,700 has acted as resistance on Bitcoin's chart, meaning price has previously struggled to move above it. A confirmed break above this zone would suggest buyers have regained control of the short-term trend.
What is Elliott Wave theory in simple terms? It's a method of reading price charts as a repeating pattern of five waves moving with the trend and three waves moving against it. Traders use it to estimate where price might currently sit within a larger cycle, though it's a probability tool, not a guarantee.
What would confirm the bullish Bitcoin setup is no longer valid? A confirmed close on the 4H chart below the recent swing low that formed during this pullback would be the key signal that the bullish structure has broken down.
Is a pullback the same as a trend reversal? No. A pullback is typically a shorter, shallower move against the prevailing trend that doesn't break key support levels. A reversal is a more significant structural shift where the broader trend direction actually changes.
How often does Bitcoin's price update on live wave-count charts? Live charts update continuously as new price data comes in, though the wave count and key levels are typically reviewed and adjusted by analysts as price structure develops, not on a fixed schedule.
Bottom Line
Bitcoin's 4H pullback has held above support so far, which keeps the broader bullish case alive with $66,700 as the level bulls need to clear next. Nothing here is a guarantee — a confirmed break below the recent swing low would change the picture. Where this goes from here depends on how price behaves at these levels over the coming sessions.
Disclaimer: This article is for informational and educational purposes only and does not constitute financial advice. Cryptocurrency markets are highly volatile; confirm current price levels and consult a licensed financial professional before making trading decisions.





Add Comment